Disruptions in global network segregation and integration in adolescents and young adults with fetal alcohol spectrum disorder
Last updated on
Mar 6, 2022
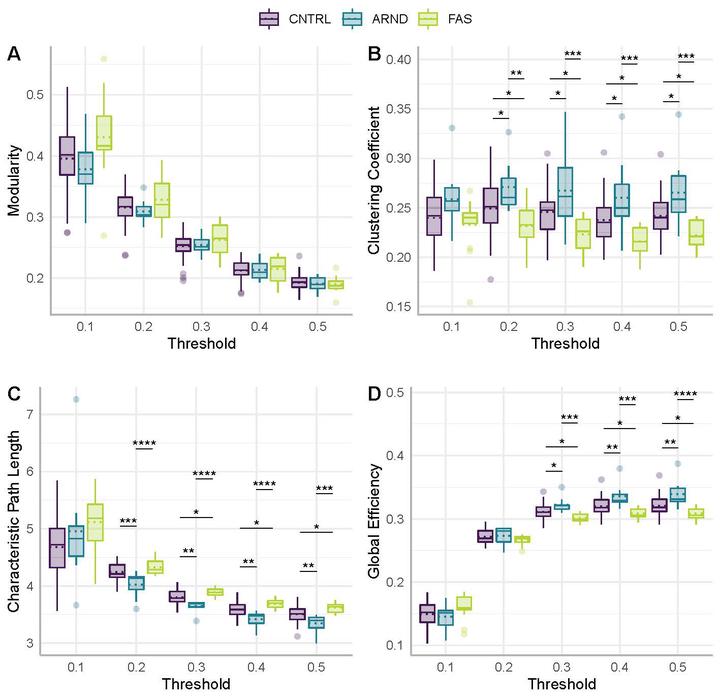
 Figure 1 Boxplots and results of between-group comparisons of graph theory metrics within threshold. Solid horizontal lines within each box represent the median, while dotted lines represent the mean. Panel A) modularity; B) clustering coefficient, C) characteristic path length, D) global efficiency. CNTRL, controls; ARND, alcohol neurodevelopmental disorder, FAS, fetal alcohol syndrome. ****, p<0.0001; ***, p<0.001; **, p<0.01; *, p<0.05. All p values are corrected by FDR method. For analyses of characteristic path length, one data point from a CNTRL participant at the 0.2 threshold was excluded as an outlier resulting in a sample size of 35. All other remaining sample sizes were CNTRL=36, ARND=9, and FAS=13.
 Figure 1 Boxplots and results of between-group comparisons of graph theory metrics within threshold. Solid horizontal lines within each box represent the median, while dotted lines represent the mean. Panel A) modularity; B) clustering coefficient, C) characteristic path length, D) global efficiency. CNTRL, controls; ARND, alcohol neurodevelopmental disorder, FAS, fetal alcohol syndrome. ****, p<0.0001; ***, p<0.001; **, p<0.01; *, p<0.05. All p values are corrected by FDR method. For analyses of characteristic path length, one data point from a CNTRL participant at the 0.2 threshold was excluded as an outlier resulting in a sample size of 35. All other remaining sample sizes were CNTRL=36, ARND=9, and FAS=13.